How To Use Your Histogram Correctly
 by
Jo Plumridge
by
Jo Plumridge
The camera’s histogram is a useful addition to your arsenal as a photographer in helping to get your shots correct ‘in camera’. Of course, the histogram is only useful if you know how to use it!
So let’s look into this powerful tool that is the histogram in more detail.
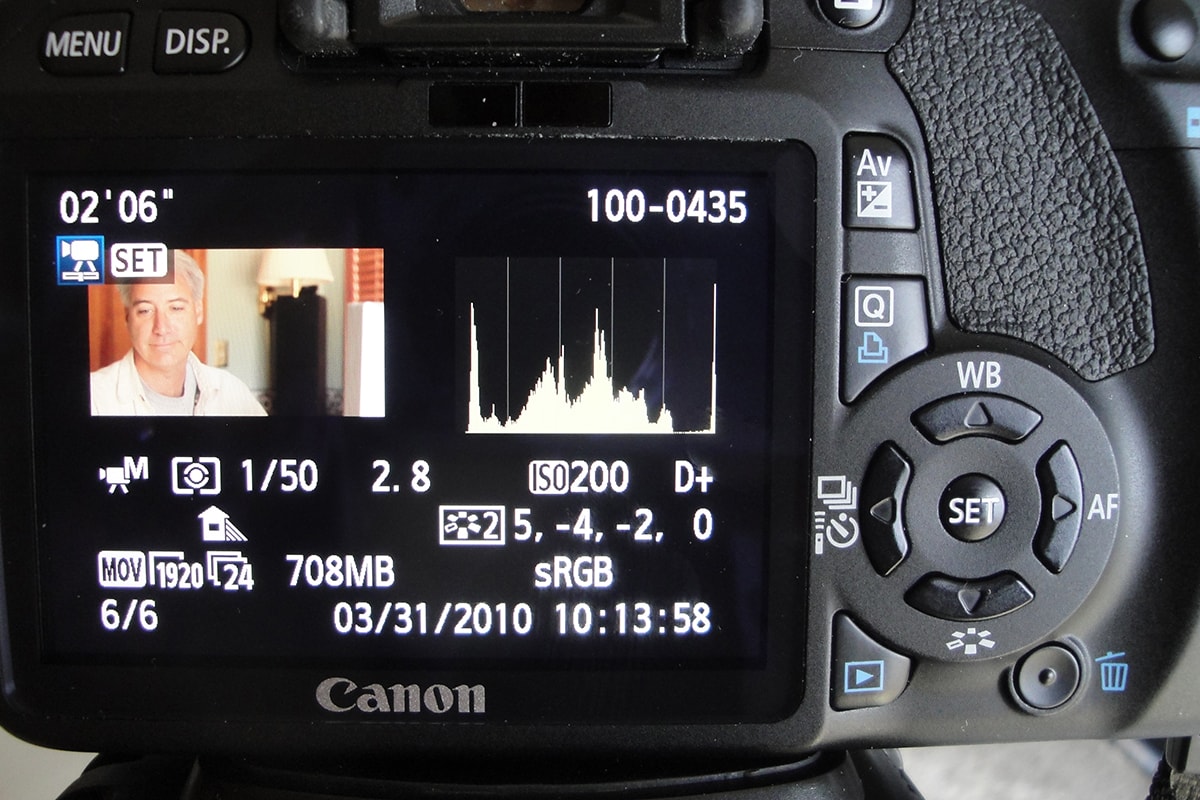
photo by Dave Dugdale
What Is The Histogram?
To put things as simply as possible, a histogram is a graphical representation of the pixels exposed in your image. On the left hand side of the graph are your blacks, whilst the right represents your whites. The middle section is your mid-tones at 18% grey. This is exactly halfway between pure white and pure black. This is your primary histogram.
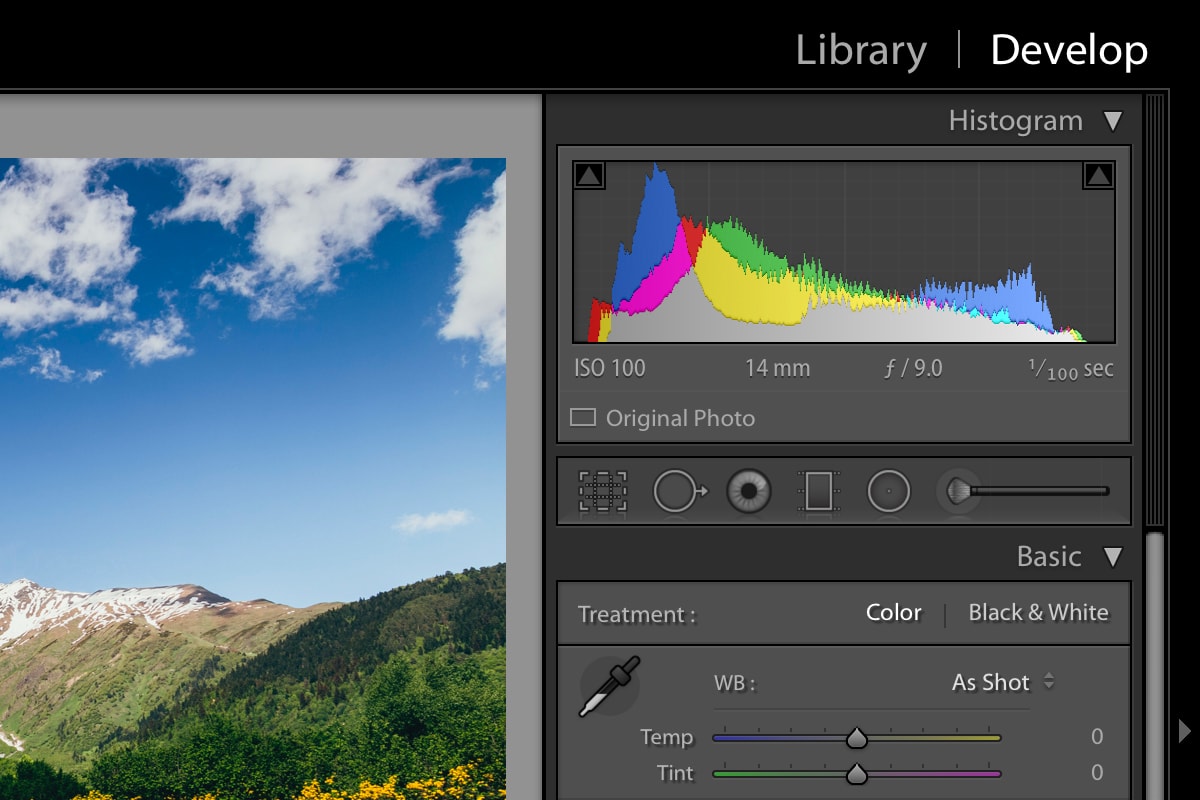
Some higher-end cameras will also have colour histograms, which relate to the RGB (red, green, blue) colour spectrum. Adobe Lightroom and Photoshop also have a histogram you can refer to when editing your photos. However, in this article we’re going to concentrate on the primary histogram.
Histogram vs LCD
Now that you know what a histogram is, you might be thinking to yourself that it would be easier to evaluate the exposure by looking at your LCD screen. This is a mistake! LCD screens have adjustable brightness that you can set yourself, so they’ll never give you a truly accurate rendition of your exposure.
You’ll be able to tell if the shot is massively under or over exposed but the screen is really only useful for checking your composition. For accurate results, the histogram is your best friend!
Using The Histogram
The horizontal axis of your histogram goes from white through mid grey to black; from left to right. This is married to a vertical axis, which I always think looks a little like a mountain range, with various peaks and troughs.
What this is actually representing is the relative quality of light for the given luminance of the scene. So, a perfectly balanced exposure will show a ‘hump’ in the middle, which tailors off on each side towards black or white.
A digital camera that uses 8-bit sampling has 255 shades of grey, meaning that the histogram goes from 0 (black) to 255 (white). The arches on your histogram essentially show the brightness of an image. So, if you take a shot and see that the majority of your vertical arch is to the right of the image you will have a high-key image, which could be overexposed. Reverse this so that most of your data is on the left and you’ll have a low-key shot, which may be underexposed.
Remember though that it’s not always a big fat negative to have a spike on one side of your histogram. For example, if you’re shooting with bright sunlight, it would be totally normal to see a sharp right-hand spike.
A completely balanced histogram isn’t always going to be your goal. What you have to bear in mind is how to read the histogram, what’s in your scene in terms of brightness, darkness and contrast, and your desired result. With these elements taken into account, you can view your histogram and make adjustments – e.g. adjusting your exposure by changing your aperture, shutter speed or ISO or even recomposing your shot to change the amount of light or dark areas in your image.
A Quick Note On Clipping
In relation to your histogram, if you have a spike touching the right edge of the histogram, your camera is telling you that this area is so bright that it can’t ascertain if there is an object there. A spike touching the left edge means you have shadow clipping and these dark areas are out of the camera’s dynamic range.
What is dynamic range? Well, it’s defined as:
the ratio between the maximum and minimum areas of luminance in a given scene
So, if your camera is on automatic, it will try and create an image that’s exposed to capture the widest possible range of lights and darks. But dynamic range on a camera can be limited, meaning that your image can be left with blown-out highlights or pitch-black shadows. If you have clipping on your histogram you have a loss of data and no amount of post-production work will bring it back.
Shadow clipping is fairly noticeable and easy to spot, but it can be harder to see highlight clipping. However, most digital cameras have the ‘blinkies’ – a flashing highlight indicator that causes the blown-out areas to blink. It’s also worth noting that clipping tends to be more prevalent in JPGs so it’s worthwhile shooting RAW as you the files will have a slightly greater dynamic range.
So, as you can see, it’s worth getting into the habit of using your histogram correctly as it can really assist you in getting great shots. As long as you remember that there’s no such thing as a perfect histogram and tailor the results to the effect you want, your histogram will become a useful tool in your arsenal.
About the Author: Jo Plumridge
Jo Plumridge is a UK based photographer, writer and lecturer. She specializes in portrait, corporate and travel photography, and writes photography, travel and comedy pieces for magazines, websites and books. You can see some of her work at her website, or follow her on Twitter.